PROBLEM
Charts and related text 'disappear' against a dark background. This happens often when you have a black or otherwise very dark slide background. The text of the Question, Answers, Chart X Axis, Percentage Labels, as well as the Vote Counter and Countdown Clock becomes almost invisible against a dark-colored background.
SOLUTION
Use PowerPoint's "Picture Format" and "Shape Format" options to adjust the color of these objects to better stand out against a dark background.
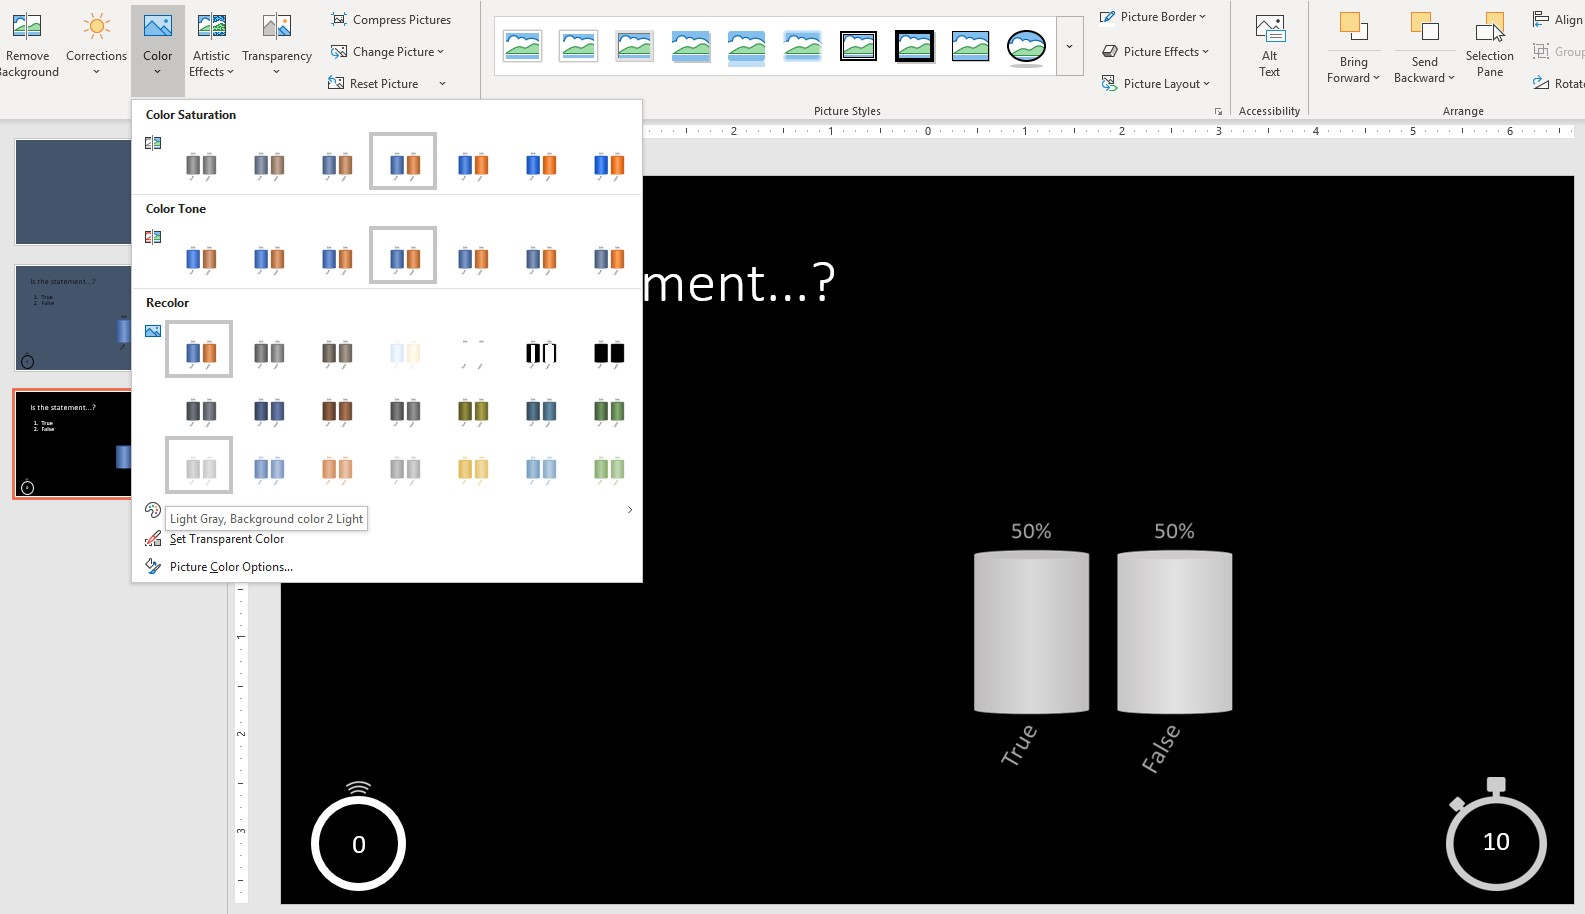
For example, you can adjust the color of the chart object by selecting/highlighting the chart and going to the Picture Format tab, then click on the Color drop-down and select any lighter combination from the Recolor menu:
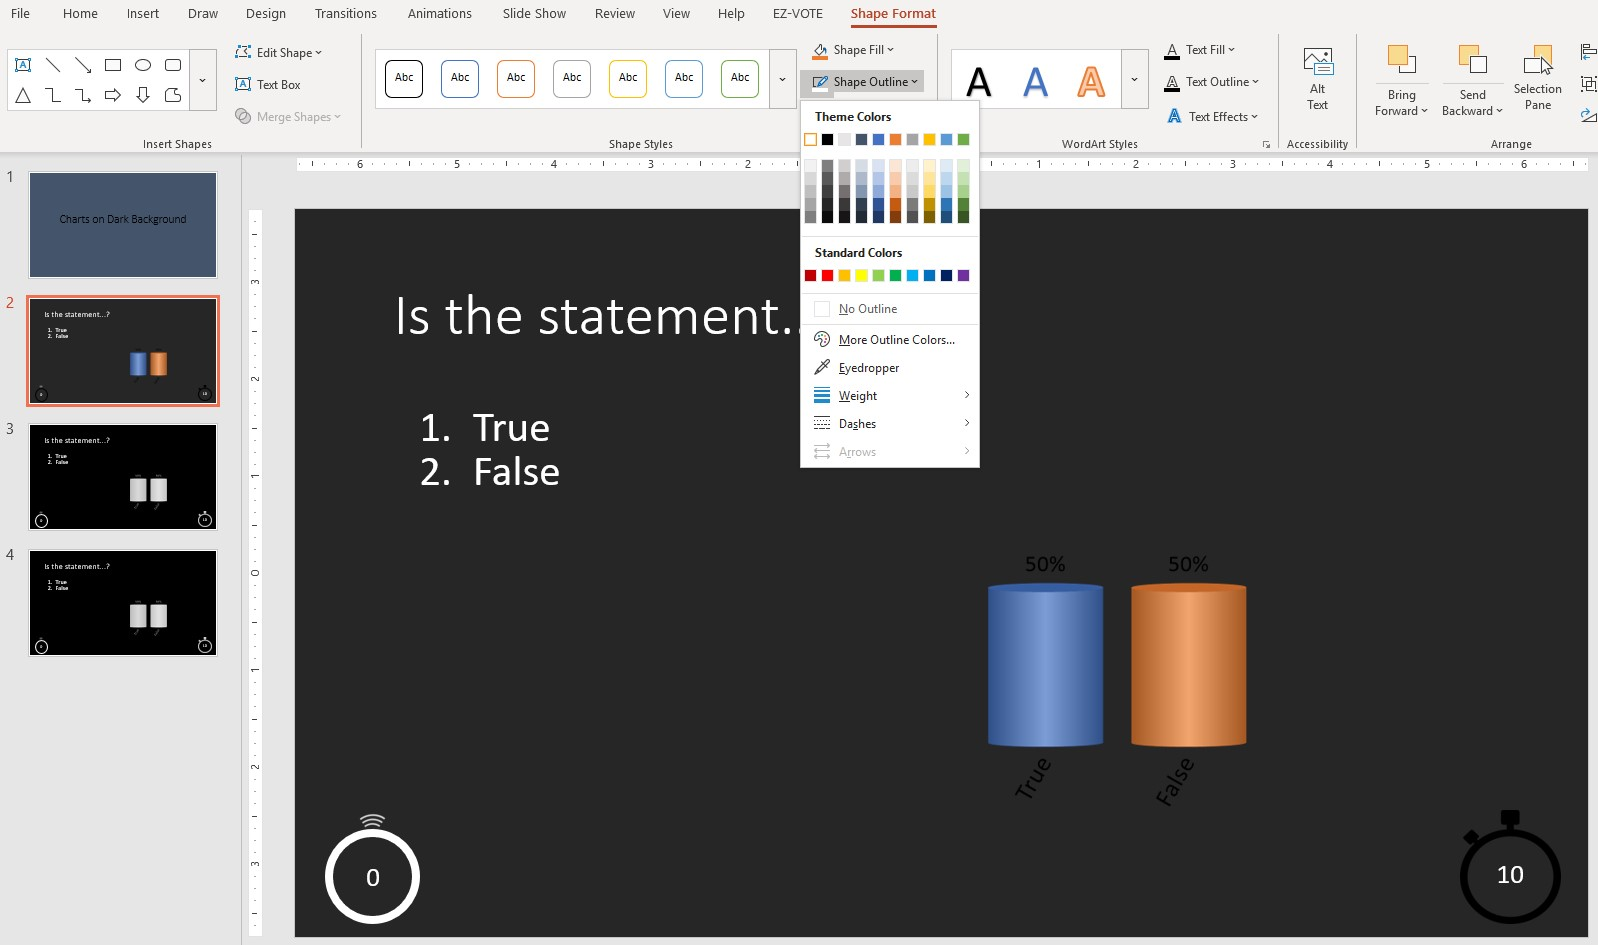
To "recolor' the Vote Counter and/or Countdown Clock, use the same approach, or as in case of the Vote Counter, you need to use the Shape Format (tab) once you selectively highlight just the interior circle (not the whole object).
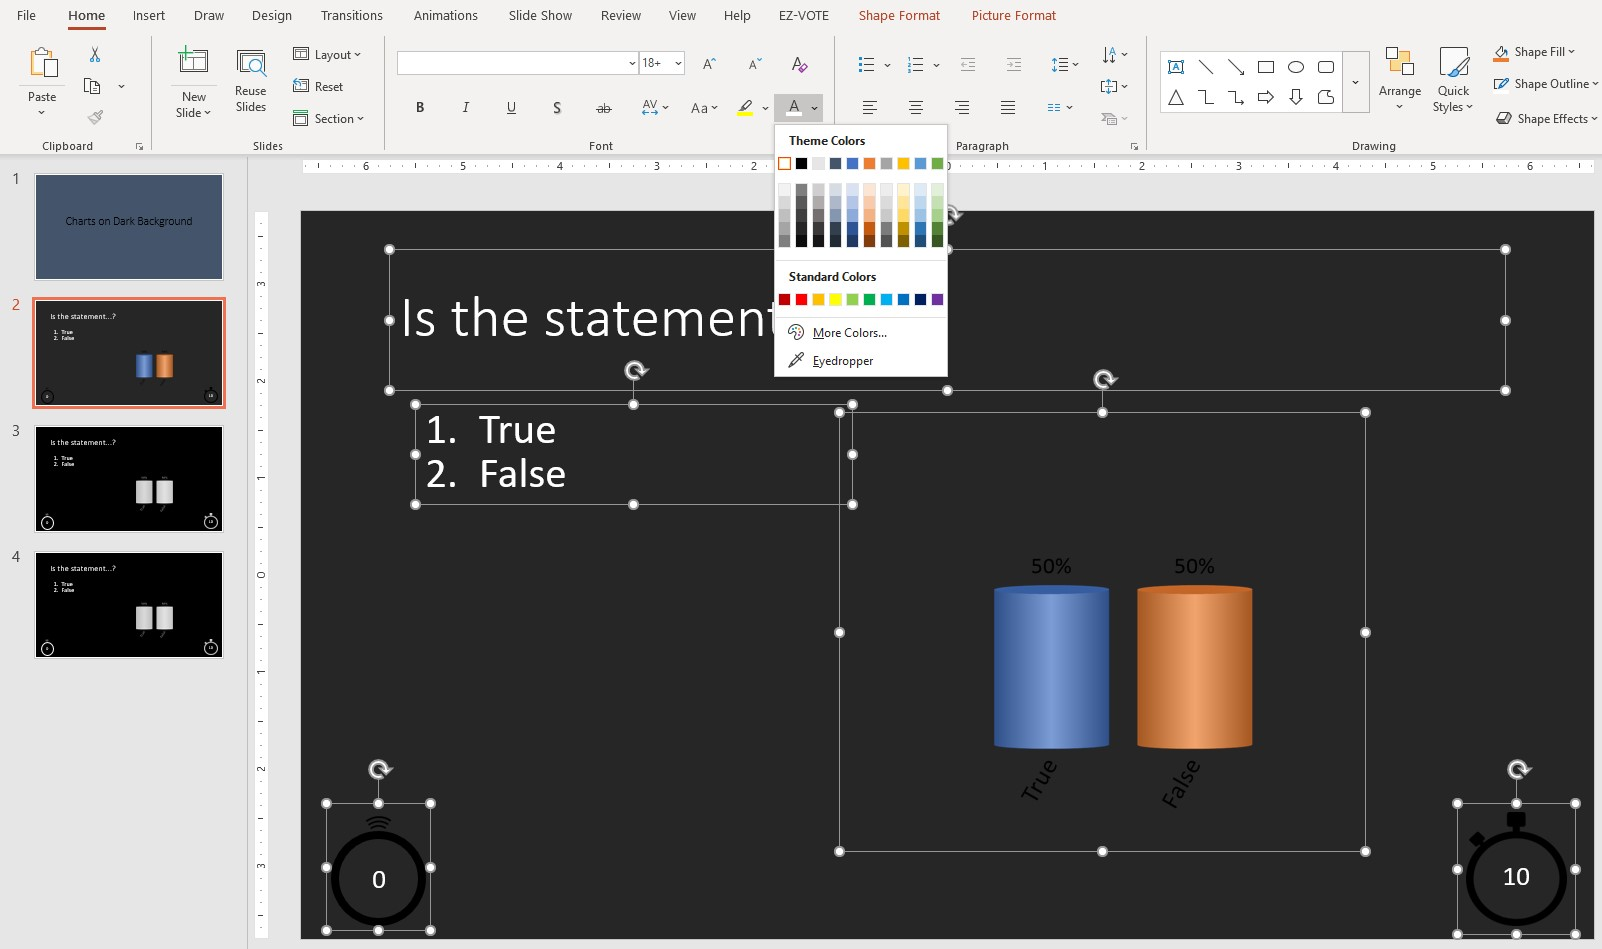
Besides these changes, you still have to change the color of the font (Question, Answers, etc... which is available on the Home tab, under Font section.
Was this helpful? Let us know below...
Was this article helpful?
That’s Great!
Thank you for your feedback
Sorry! We couldn't be helpful
Thank you for your feedback
Feedback sent
We appreciate your effort and will try to fix the article