When you insert a question (polling) slide into your presentation, it will come with a default chart/graph.
You can change the chart type at any time either on just one slide, or across the whole presentation.
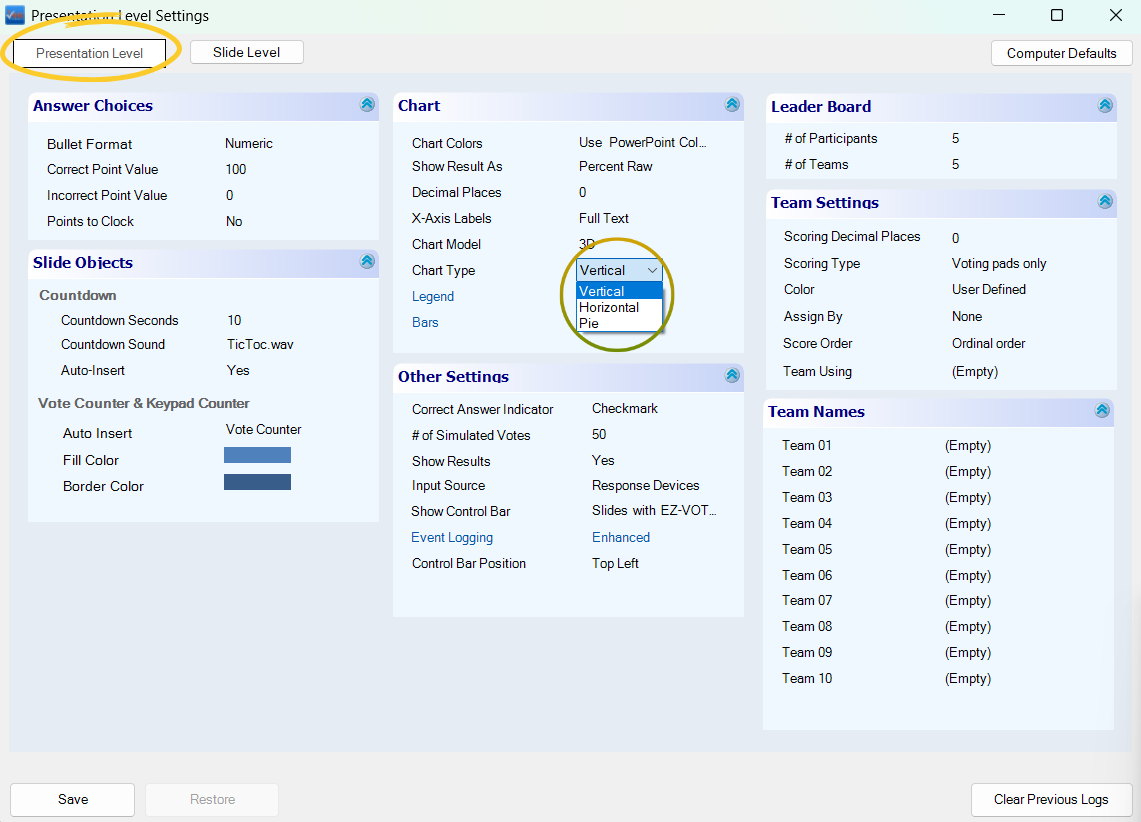
To change the chart type across the whole presentation, just go to Tools --> Settings --> Presentation Level and Chart Type section:
To quickly change the chart, simply use the Graph Type drop-down menu on the EZ-VOTE toolbar:
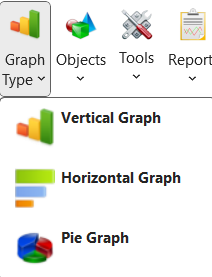
Once you make your selection, the last used graph type will be now the new default and you can simply click the top section of the button to change all the other slides to the same type:

TIP: the top section of most buttons on the EZ-VOTE toolbar work this way - they change with the last choice you made, so that you can quickly repeat it without having to use the drop-down-and-select combination.
Feel free to let us know if this was helpful.
Was this article helpful?
That’s Great!
Thank you for your feedback
Sorry! We couldn't be helpful
Thank you for your feedback
Feedback sent
We appreciate your effort and will try to fix the article